BAR DEPTH

TrackTicks Bar Depth

A live scoreboard under your candles, showing what actually traded inside every single bar.

A row of live numbers under every candle that shows who was actually buying and selling, and how many separate trades it took: Volume, Delta, Cumulative Delta, and trade counts, updating tick by tick.
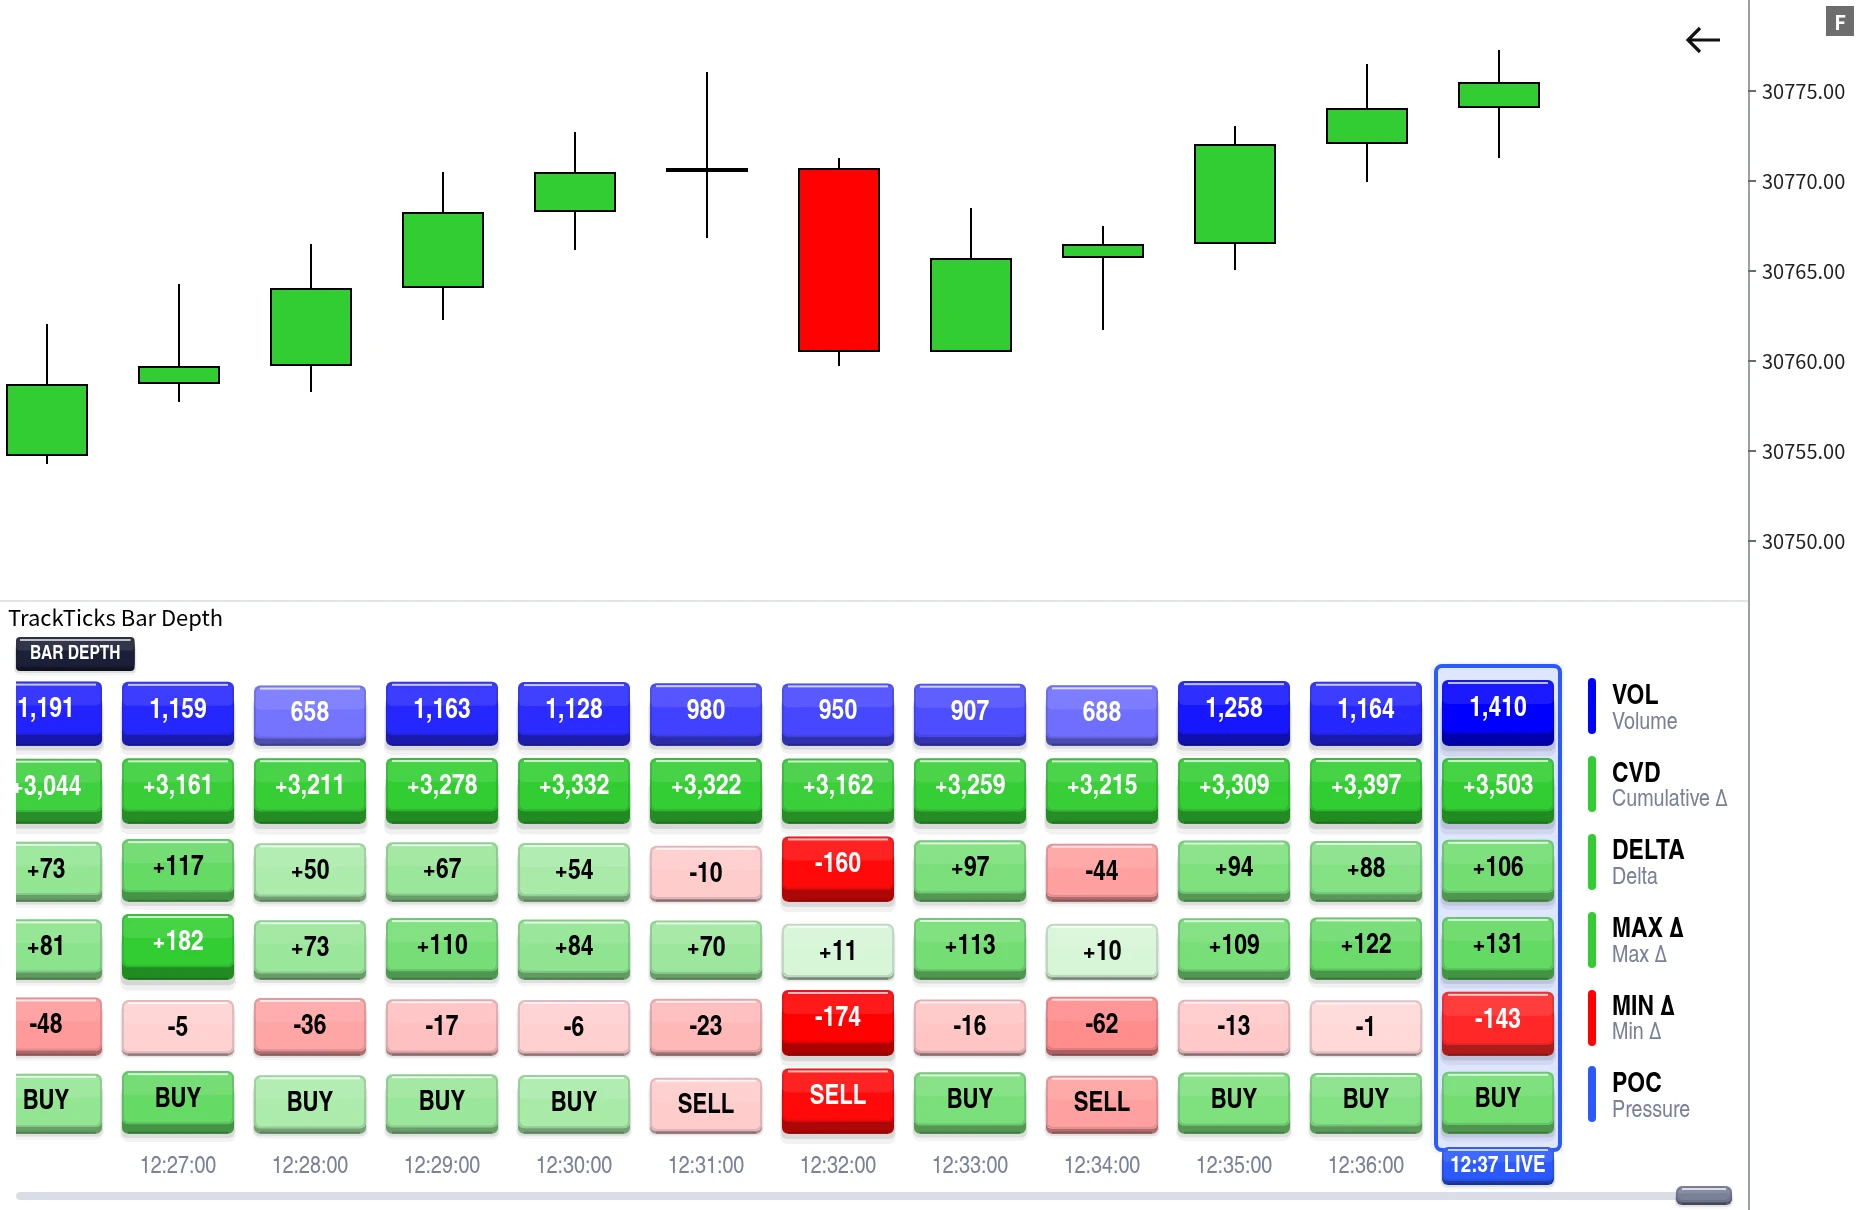
TrackTicks Bar Depth order flow statistics strip on a NinjaTrader 8 chart
Setup

How It Works

Add it, pick your rows, and it starts counting.

1

Add it to your chart

It appears as its own resizable panel beneath your candles. Drag the divider to set the height.

2

Choose your rows

Assign any of nine stats to up to nine rows, in any order, or switch rows off entirely.

3

Scroll it independently

Move back through history using the strip's own scrollbar, without touching your chart's position.

4

Set your session reset

Pick a daily reset time for Cumulative Delta, and click any bar to add your own on top.

Overview

What it does

Bar Depth puts a compact statistics strip under your candlestick chart, and fills it live as trades print.
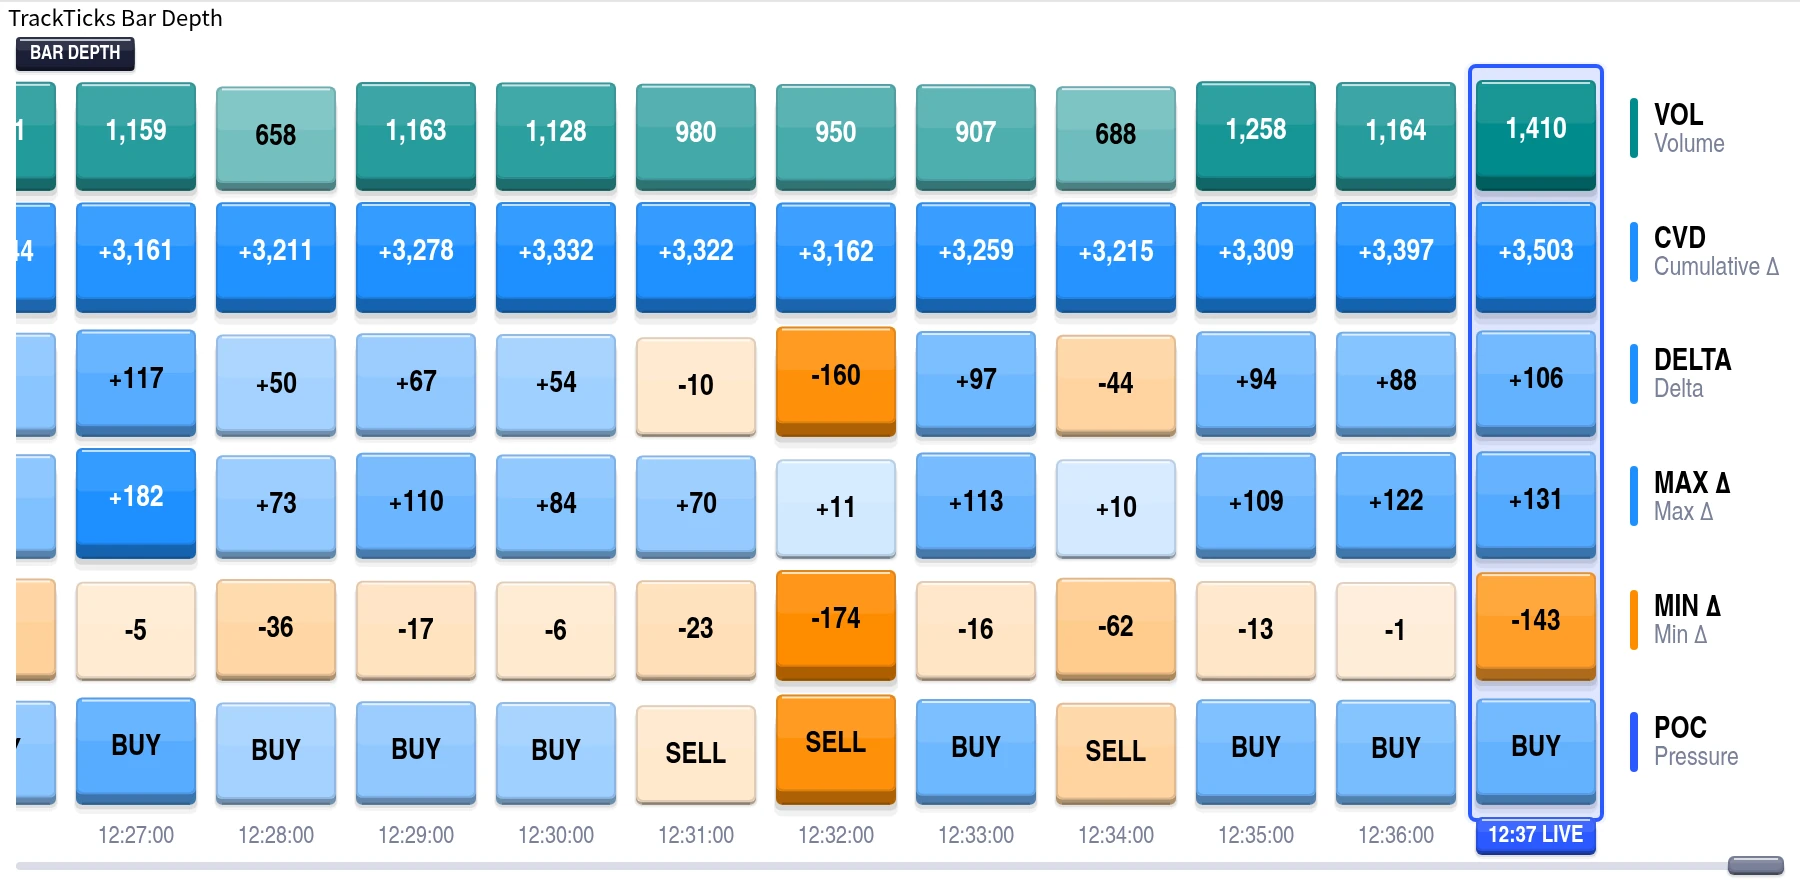
Every bar, broken downVolume, Delta, Cumulative Delta, Min and Max Delta, a buyer/seller Point of Control read, and trade counts, for every single bar on the chart.
Its own tick engineThe same standalone classification that powers Big Print and Profile+. Each trade is checked against the best bid and ask the instant it arrives.
Real data, not a chart typeThe numbers come from actual trades, not sampled, not estimated after the fact, and without needing a footprint chart to produce them.
Bar Depth statistics strip showing Volume, CVD, Delta, Max and Min Delta and Point of Control per bar
A row per stat, a column per bar, colour-scaled so the outliers stand out at a glance.
Features

Nine stats, nine rows, your order

Pick what you want to see and where it sits. Turn off what you don't.
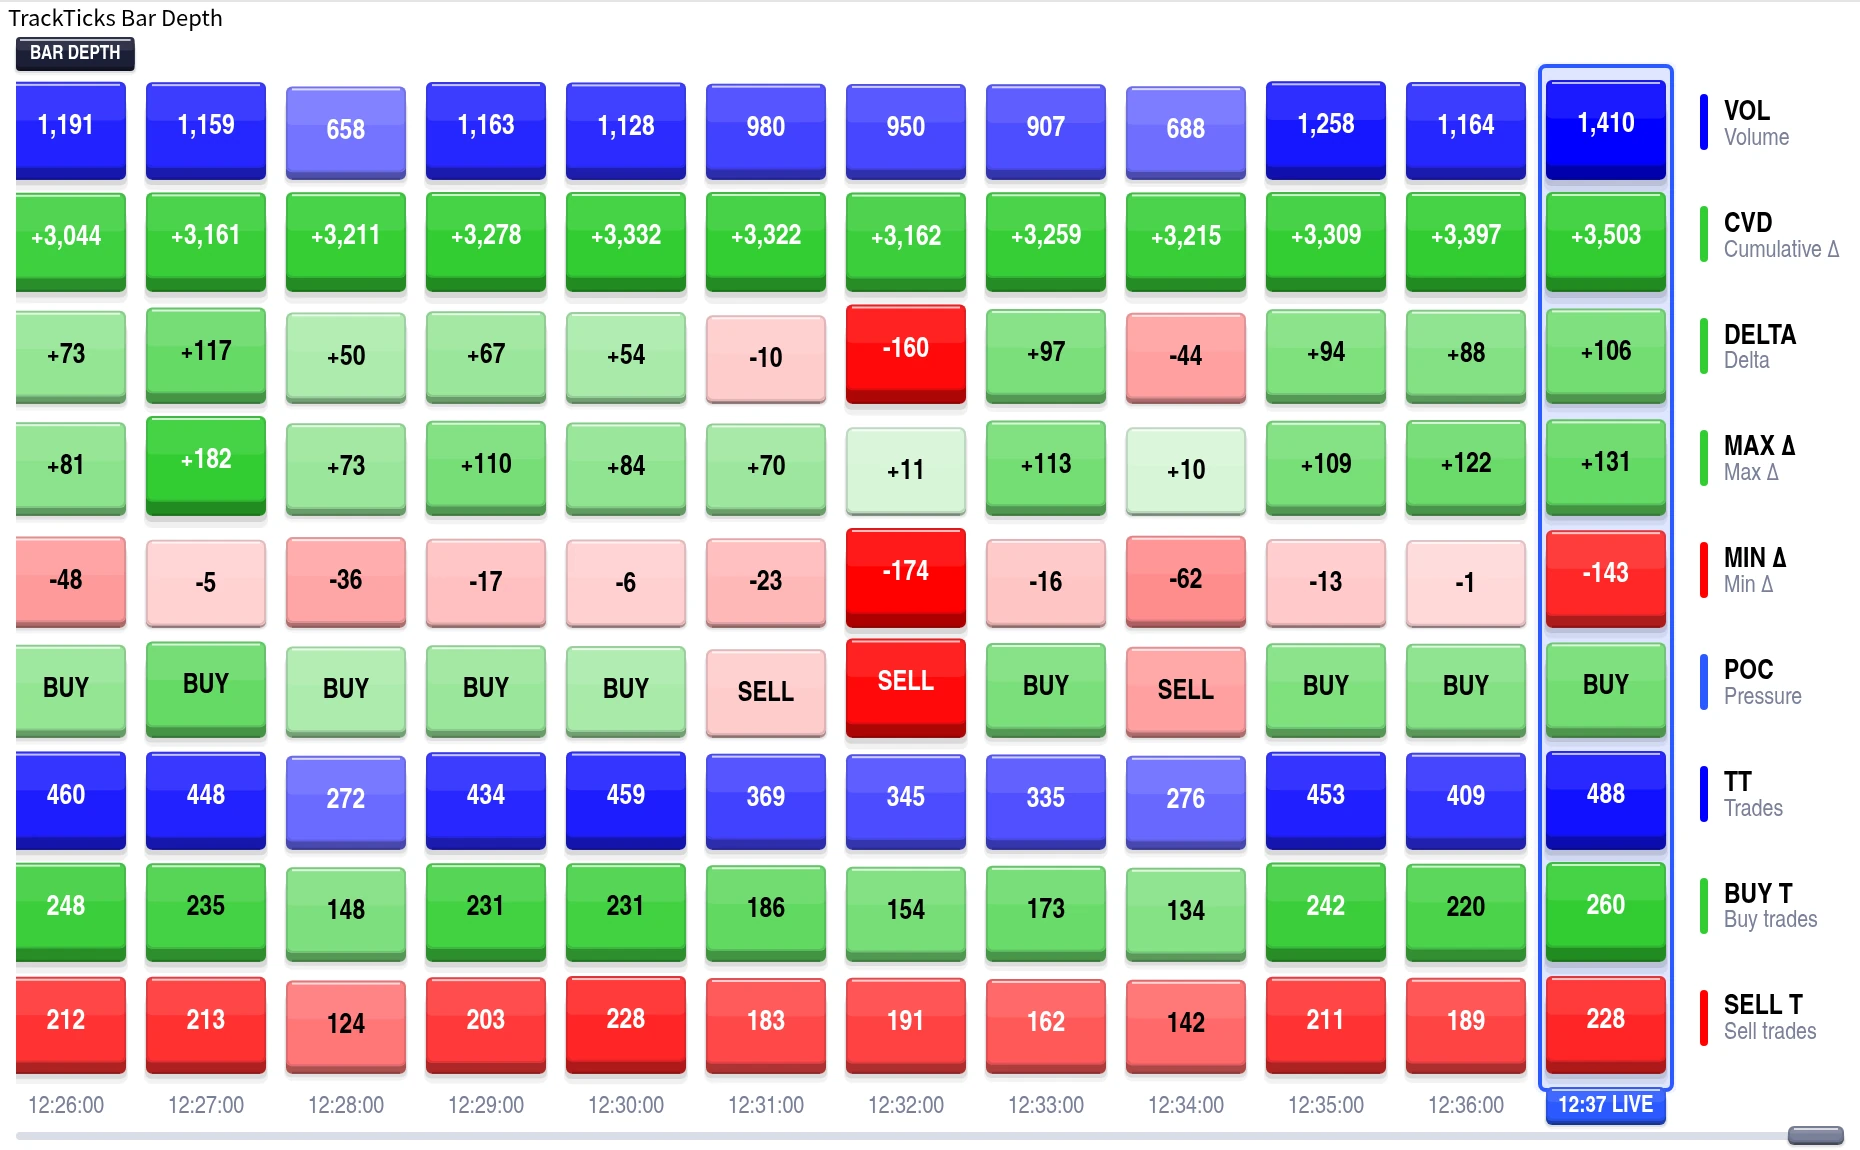
VOLVolume
DELTADelta
CVDCumulative Delta
MIN DMin Delta
MAX DMax Delta
POCPoint of Control
TTTotal Trades
BUY TBuy Trades
SELL TSell Trades
Trade counts, not just volumeTotal, Buy and Sell Trades show how many individual prints made up a bar. A few large orders look very different from a flurry of small ones.
A dominance read per barPoint of Control colours each bar green or red by whichever side won it overall, so the balance of the session reads at a glance.
Rows off is a valid answerRun all nine or run two. Any stat can go in any row, and rows you don't want simply don't render.
Bar Depth strip configured with all nine statistic rows enabled
All nine rows enabled at once. Every one of them is optional, and the order is yours.
Styled to your chart
Every colour, size and weight is yours to set
Grid line colourBackground colourBackground opacity Text colourPer-stat coloursCell value font size Row label font sizeTime axis font sizeBold text mode Cell widthInitial scroll offsetPanel height
Signature Feature

Custom Session Breaks

Cumulative Delta is only as useful as the point you start counting from.
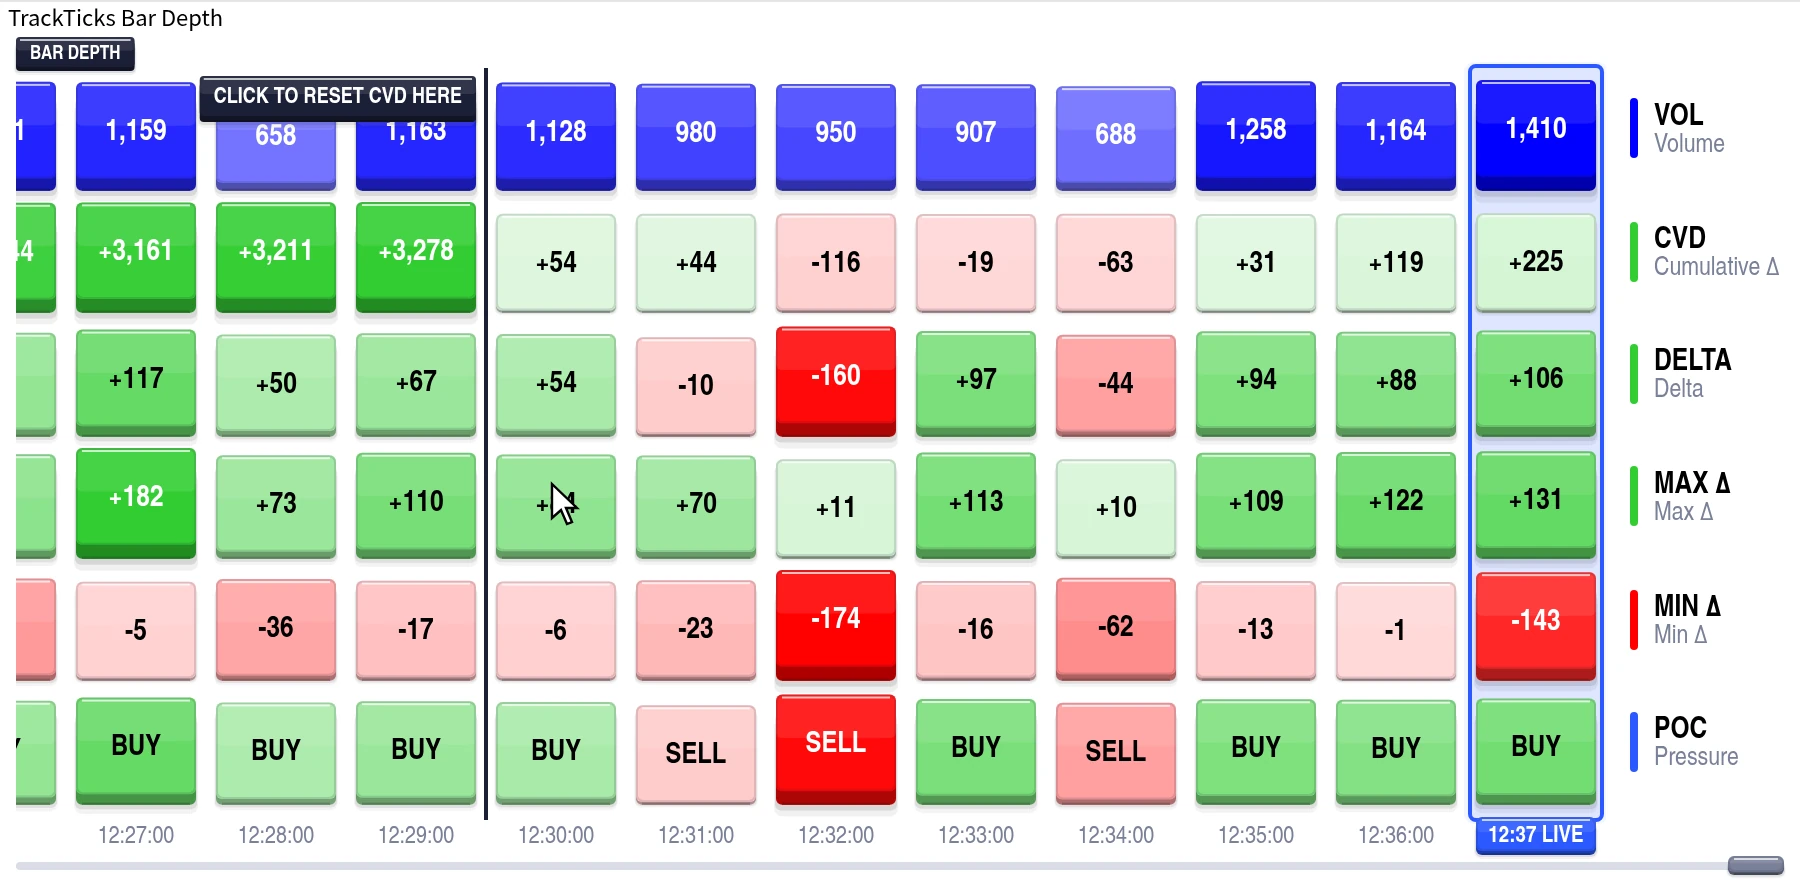
A daily reset you chooseCumulative Delta resets automatically at a Session Start time you set.
Click any bar to add your ownMark an extra manual reset point directly on the strip, layered on top of the daily reset, so you can measure from the open, from a range break, from wherever matters.
Toggle the whole thing offIf you only want the daily reset, switch custom breaks off entirely and the strip goes back to a single clean count.
Clicking a bar column in the Bar Depth strip to add a Cumulative Delta session break
Click any bar column to drop a Cumulative Delta reset exactly where you want to start counting.
How It's Built

Built From Real Trades, Not a Chart Type

Most per-bar order flow comes from a special bar type. This doesn't.
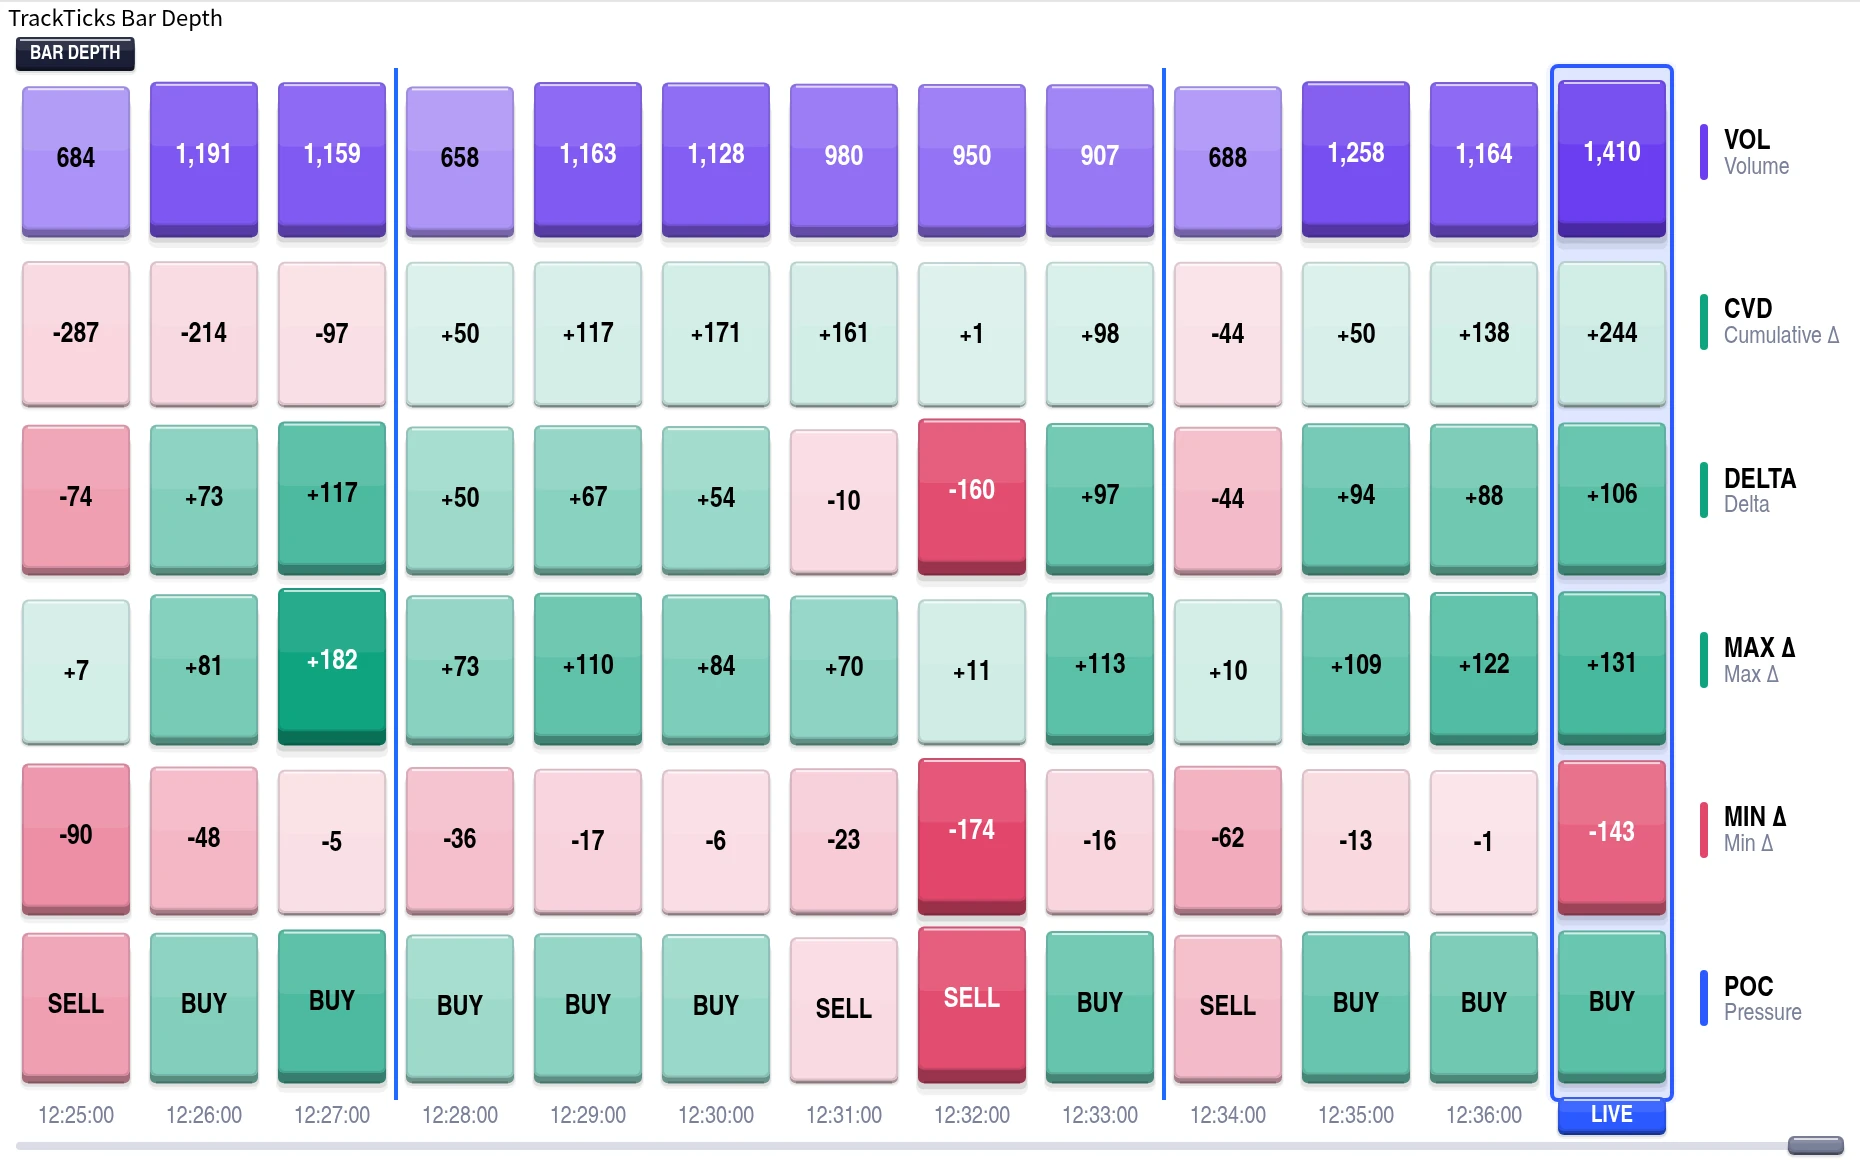
Bar Depth strip with custom colours and blue session break lines marked across the session
Custom colours, custom session breaks. The blue lines mark where Cumulative Delta was reset.
Classified against bid and askAt or above the best ask counts as buyer-initiated, at or below the best bid counts as seller-initiated, taken from the same tick stream Bar Depth reads itself.
Volume straight from the barRead directly from your chart's own bar data, so it always agrees with the candles it sits under.
Completely decoupled from your chartIts own cell width, scroll offset, scrollbar and time axis. Zooming or scrolling your candles never shifts the strip.
Built For

Who it's for

Traders who want a constant, compact read of what traded inside each bar, sitting next to a normal candlestick chart.

You want per-bar order flow always visibleVolume, Delta, Cumulative Delta and trade counts on screen at all times, without switching to a different chart type to see them.
You want it working straight awayBar Depth brings its own tick-by-tick engine, so the per-bar numbers are there from the moment you add it to a chart.
You like your candles as candlesA footprint chart replaces your chart. This sits underneath it, so the price action you already read stays exactly as it was.
You track Cumulative Delta through a sessionA daily reset you choose, plus manual breaks wherever you want to start counting again.
You want the layout to be yoursNine stats, any order, any rows off, and full control of colours, fonts and sizing.
You're on NinjaTrader 8 with a live feedFull accuracy on the delta and trade-count rows needs a feed providing CME Level 1 data with Tick Replay enabled.
Requirements

Requirements

Runs on NinjaTrader 8. Bar Depth builds its per-bar statistics on its own tick-by-tick engine, so it works on any standard chart type. Full accuracy for Delta, Cumulative Delta, Min Delta, Max Delta, and the trade-count rows requires a live data feed providing CME Level 1 data, with Tick Replay enabled on the chart's data series for accuracy on historical bars. Volume is read directly from the chart's own bar data and remains accurate regardless of tick or bid/ask availability. If your feed or instrument doesn't provide CME Level 1 data, trades still process tick by tick using a midpoint-based classification in place of a true bid/ask comparison. Point of Control in this indicator is a simplified buyer/seller-dominance read based on each bar's overall Delta, not a price-level point of control.

Video

Full Walkthrough Video

Every setting explained, plus real chart examples of TrackTicks Bar Depth in use.

The Suite

The Full TrackTicks Suite

Bar Depth is one part of the full order flow suite. All four indicators are included in a single subscription.

New to order flow terms like Delta, Point of Control, or Footprint charts? See the glossary →

Disclaimer

TrackTicks Bar Depth is a charting and data-visualization tool. It does not generate buy or sell signals, does not predict future price movement, and is not a substitute for your own analysis, judgment, or risk management. Accuracy of the Delta, Cumulative Delta, Min Delta, Max Delta, and trade-count figures depends entirely on the completeness and timeliness of the data supplied by your NinjaTrader connection, data feed, and broker.

Trading futures carries a substantial risk of loss and is not suitable for everyone. See the full site disclaimer for complete terms.


Works With
TrackTicks Support Usually replies within 24 hours
Have a question about setup, billing, or an indicator? Send us an email and we'll get back to you.
Email Us support@trackticksindicators.com