PROFILE+

TrackTicks Profile+

Draw a box on your chart and see exactly what traded at every price inside it, split by who was buying and who was selling. A full volume profile and a live bid/ask profile, in one indicator.
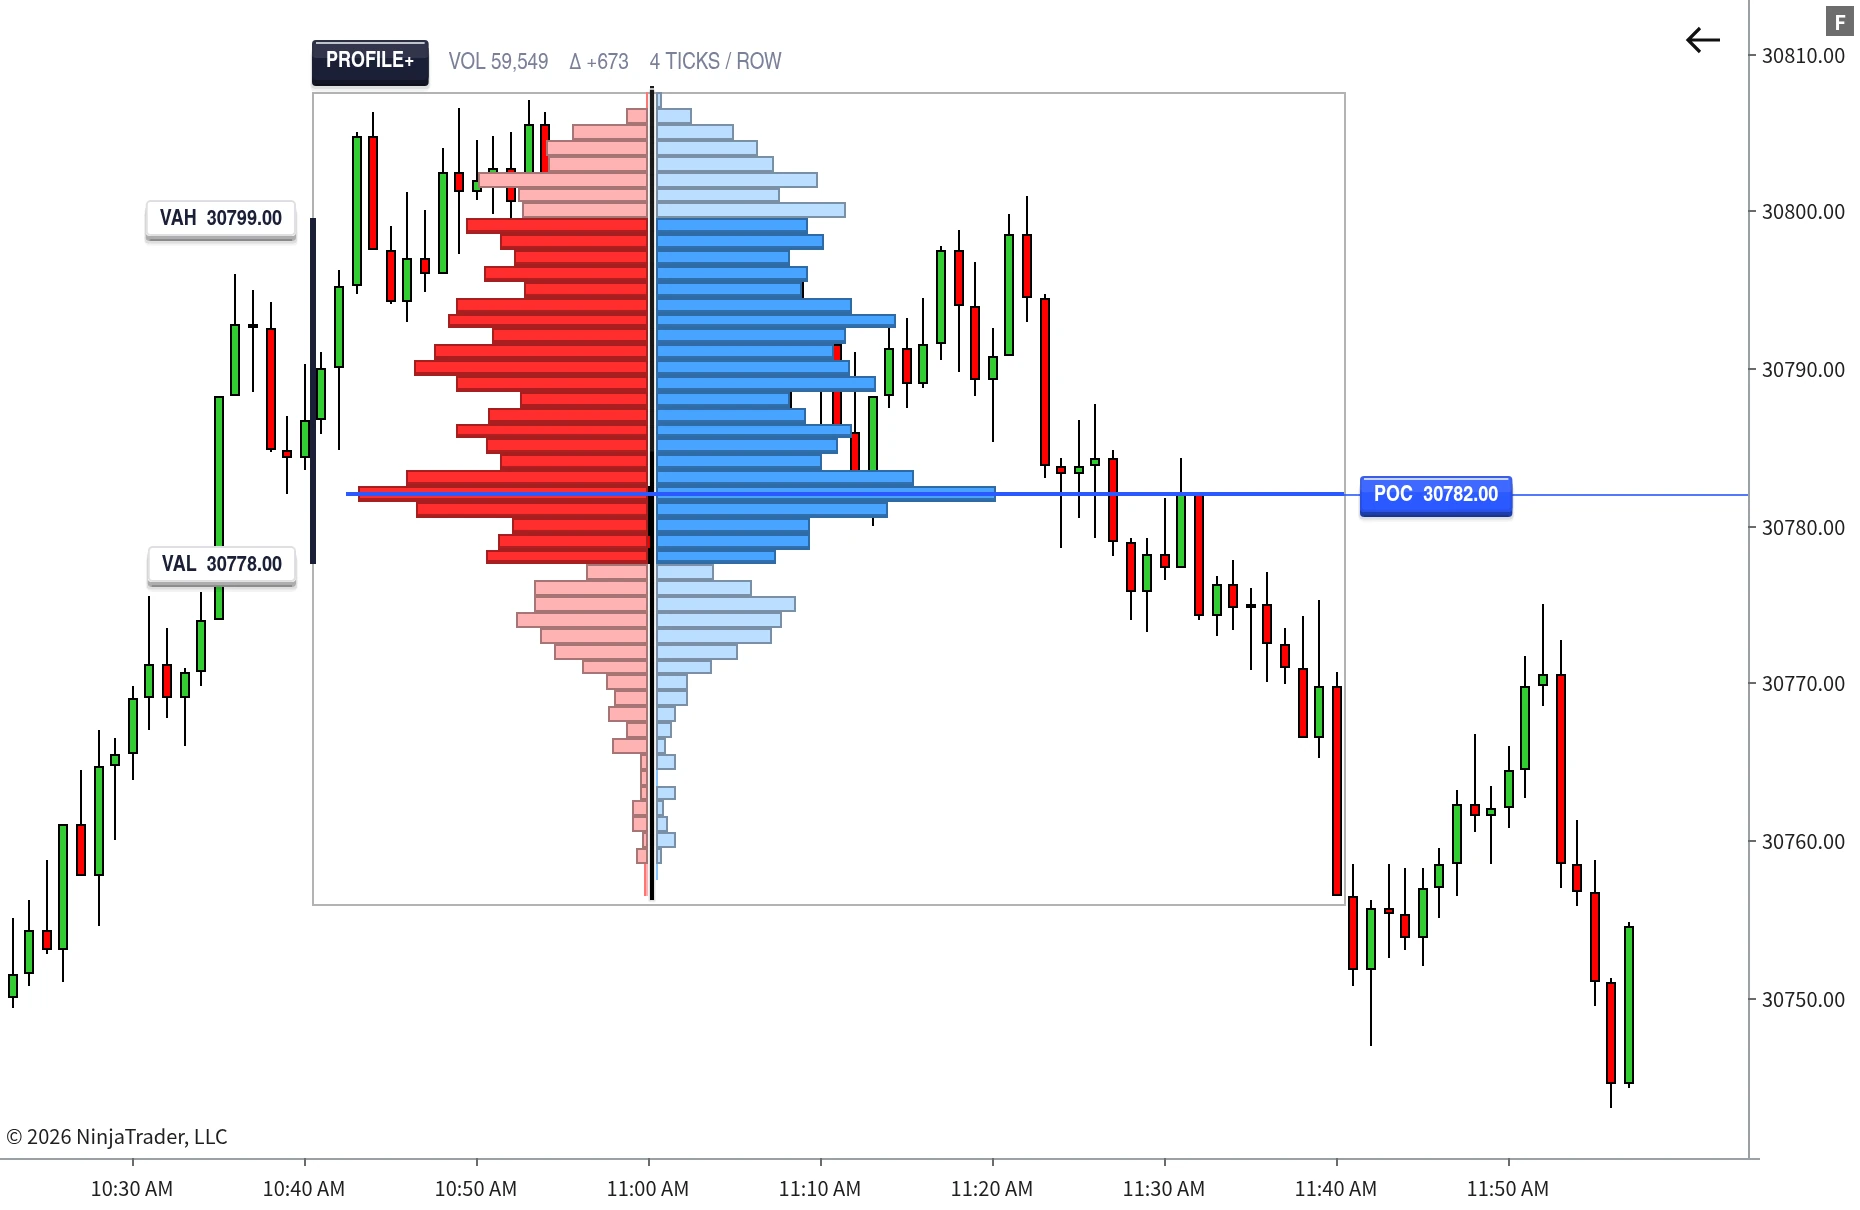
TrackTicks Profile+ bid/ask volume profile on a NinjaTrader 8 chart
Setup

How It Works

Draw a box. Read it however you want.

1

Draw your zone

Drag a box on the chart to set which bars and which price range get profiled. Resize any edge at any time.

2

Pull it past the last candle

Drag the right border out into the space ahead of price, and every bar that forms inside it is built into the profile as it trades.

3

Pick how you read it

Switch between six display modes on the fly, all built from the same live tick data.

Overview

What it does

A full volume profile and a live bid/ask profile over any zone you draw, both built from the same tick data.
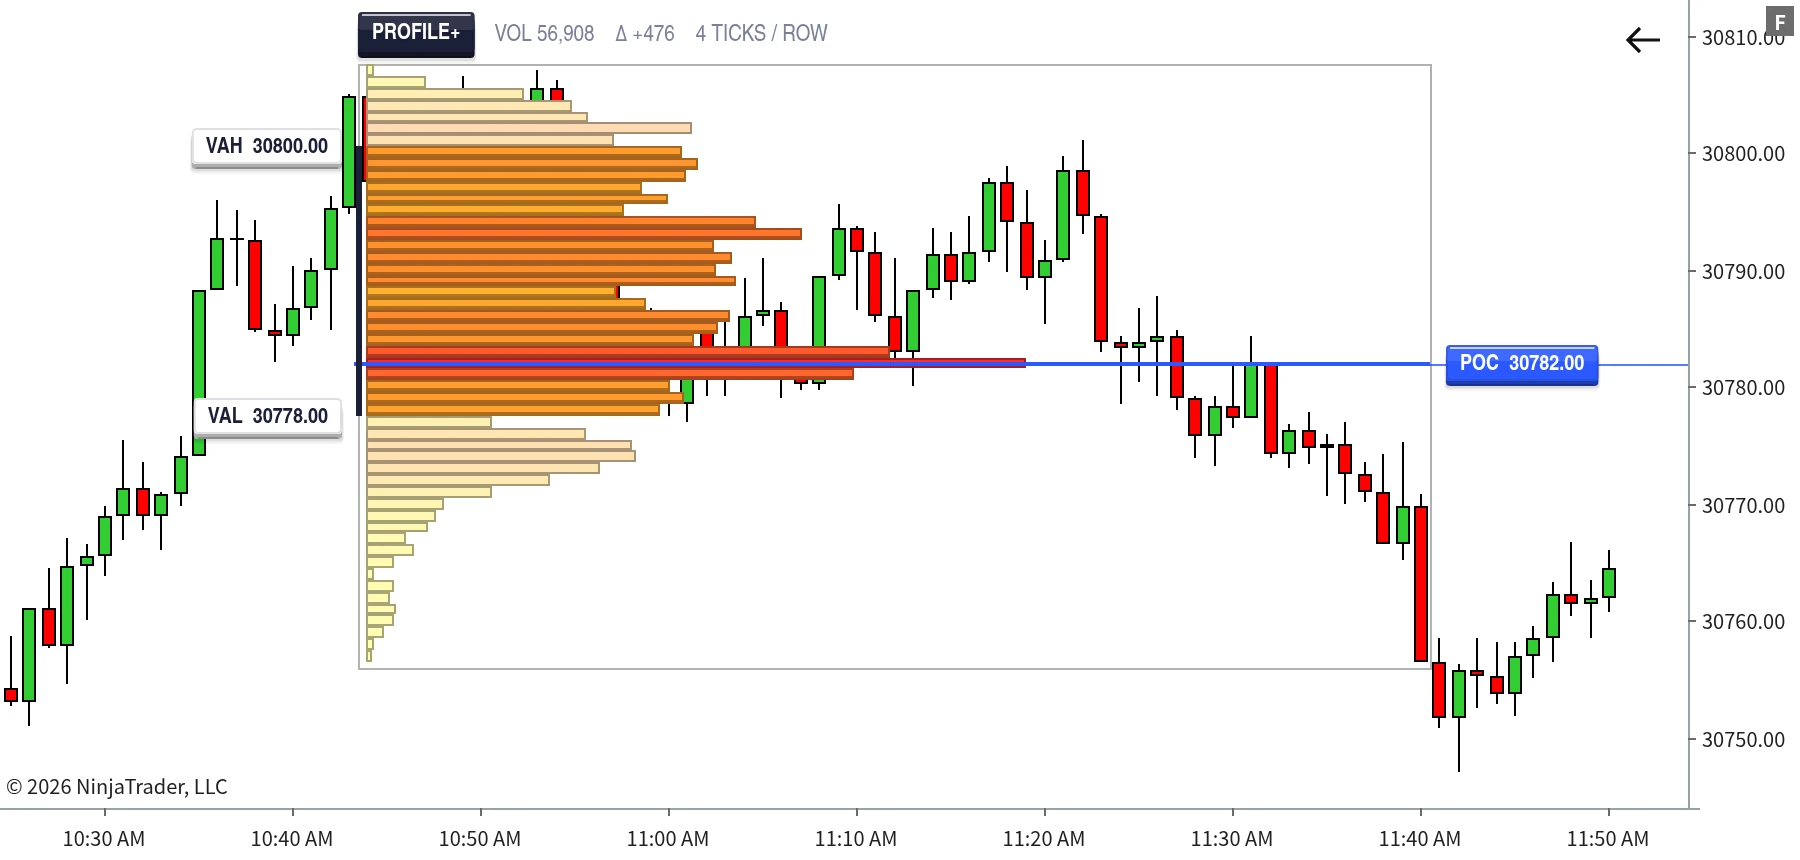
A true volume profileA horizontal read of exactly how much traded at every price level in your range, so the thick shelves and the thin air are both obvious.
And a bid/ask profile from the same dataEvery level also carries real buy-side and sell-side volume, so you can show both sides together, isolate one, or read the difference between them.
Over any range you drawAn opening drive, a full session, or weeks of history. Draw the window you want to study and the profile is built for exactly that.
Profile+ in Heatmap mode showing volume intensity at each price level with the Point of Control marked
Heatmap mode. Colour intensity scales with volume, so the heaviest nodes stand out without reading a number.
Features

Six ways to read the same data

Every mode is built from the same live tick stream. Switch between them on the fly without redrawing anything.
VolumeOne bar per price level, sized by total volume traded there.
HeatmapThe same shape, but colour intensity scales with volume too.
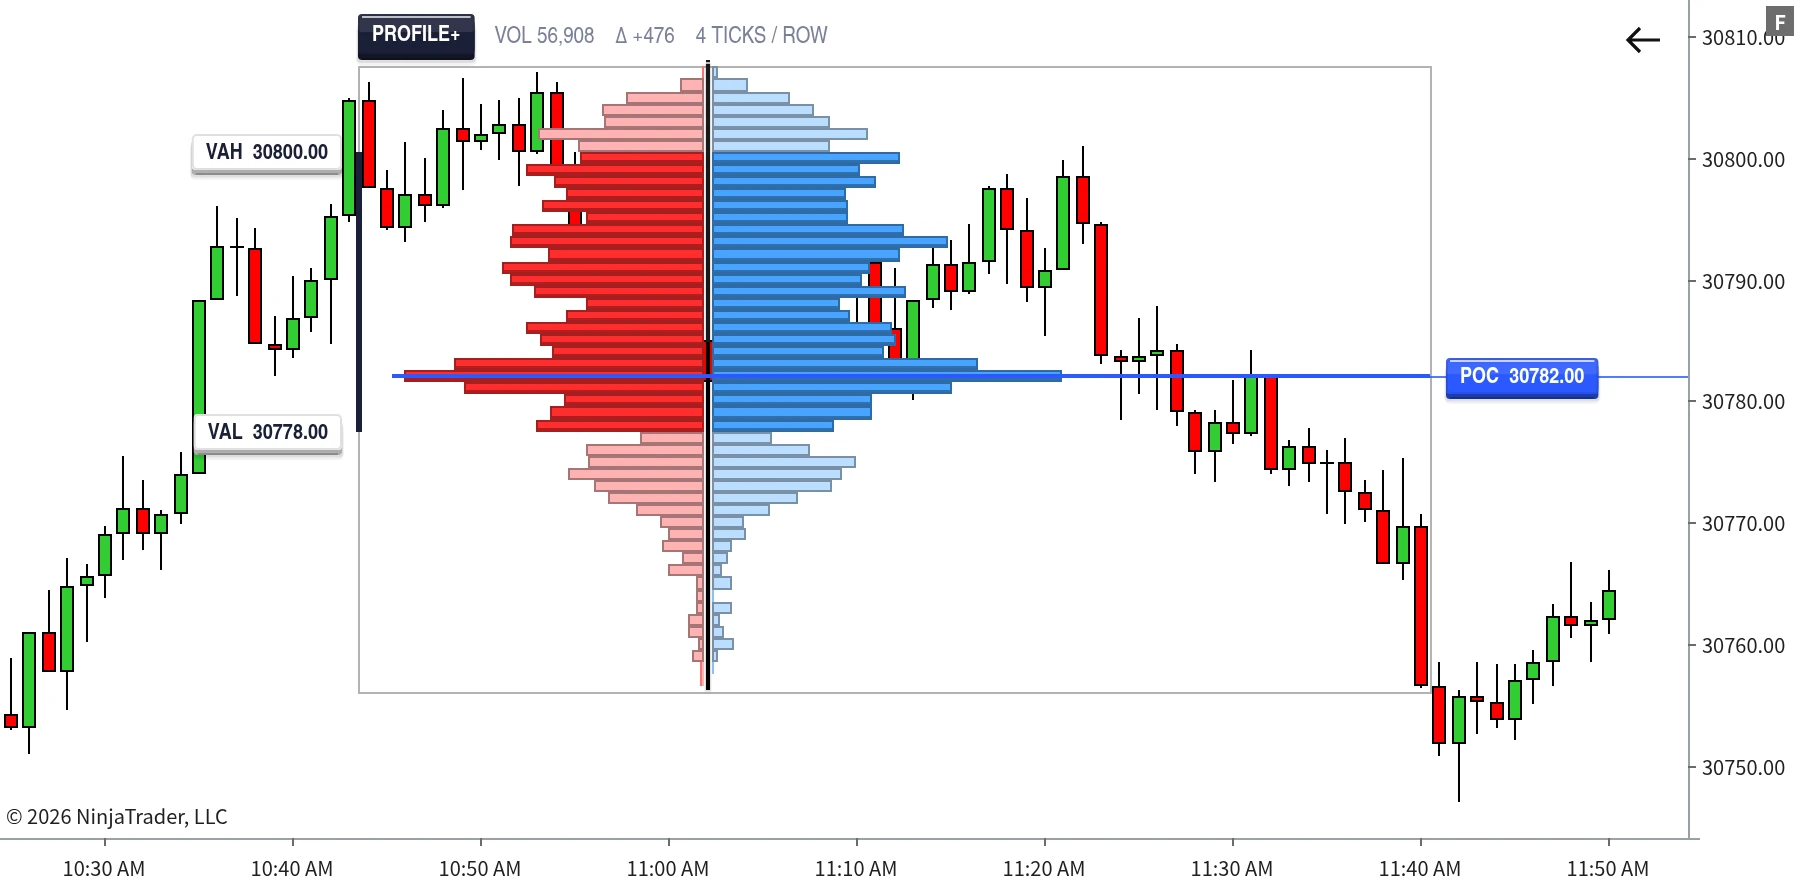
Split Bid/AskBuy and sell volume on opposite sides of a centre line.
Bid OnlyIsolate the bid side when that is all you want to study.
Ask OnlyIsolate the ask side on its own, same shape, one side.
DeltaLength by total volume, colour by which side dominated.
The same shape, a different questionVolume asks where size traded. Split Bid/Ask asks who was doing it. Delta asks who won. All from one drawn zone.
Your own resolutionBy default every price tick gets its own row. Turn up Tick Aggregation to merge consecutive ticks into broader rows, without losing accuracy underneath.
Pin it to the screen edgeOptionally keep the profile fixed to the left or right of the chart as you scroll, so it stays visible instead of scrolling out of view.
Profile+ in Split Bid/Ask mode with buy and sell volume on opposite sides of a centre line
Split Bid/Ask mode. Buy-side and sell-side volume at every level, from the same drawn zone.
Signature Feature

Point of Control and Value Area

The two levels that tell you where this range was actually decided.
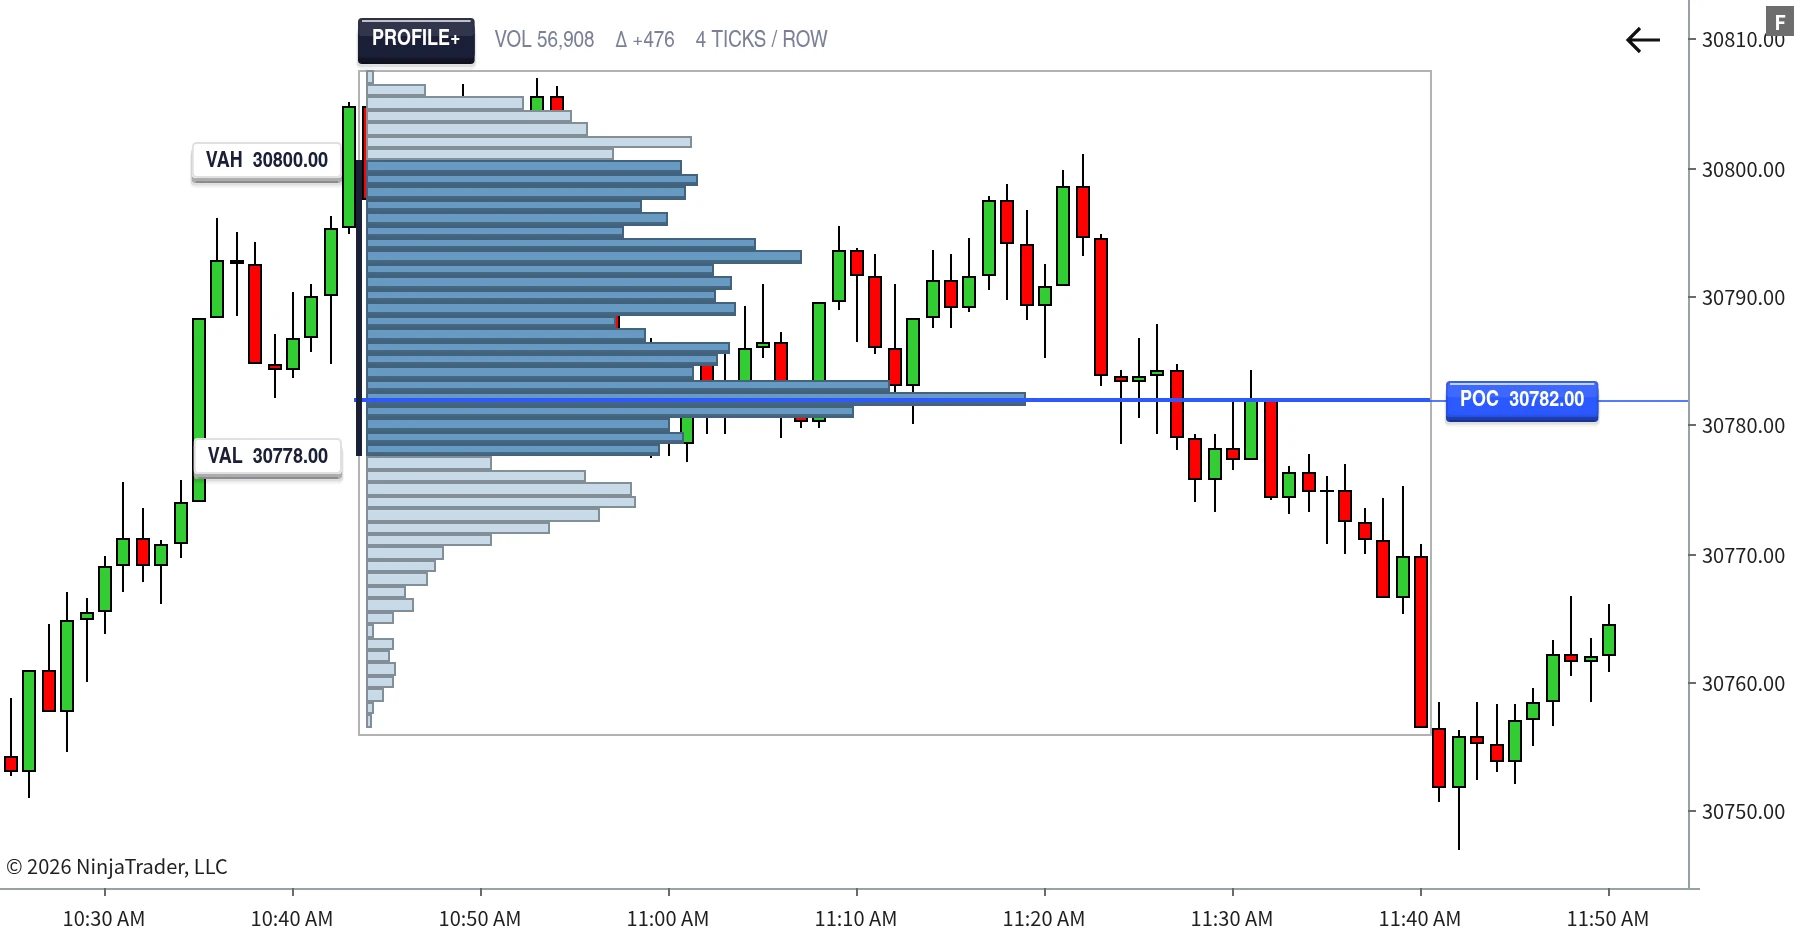
Point of Control, found for youThe single price level with the most combined volume in your zone, highlighted automatically and updated live as volume shifts.
An extension ray forwardThat level is carried forward as new bars form, so you can see price returning to it or leaving it behind.
Value Area, dimmed outsideCalculated with the standard market-profile method at a percentage you set, 70% by default, with everything outside it automatically faded back.
Profile+ in Delta mode with the Point of Control level marked across the chart
Delta mode with the Point of Control carried forward as a ray across the chart.
How It's Built

Every Real-Time Trade Tick, Not an Estimate

Nothing is summarised, sampled or batched before it reaches you.
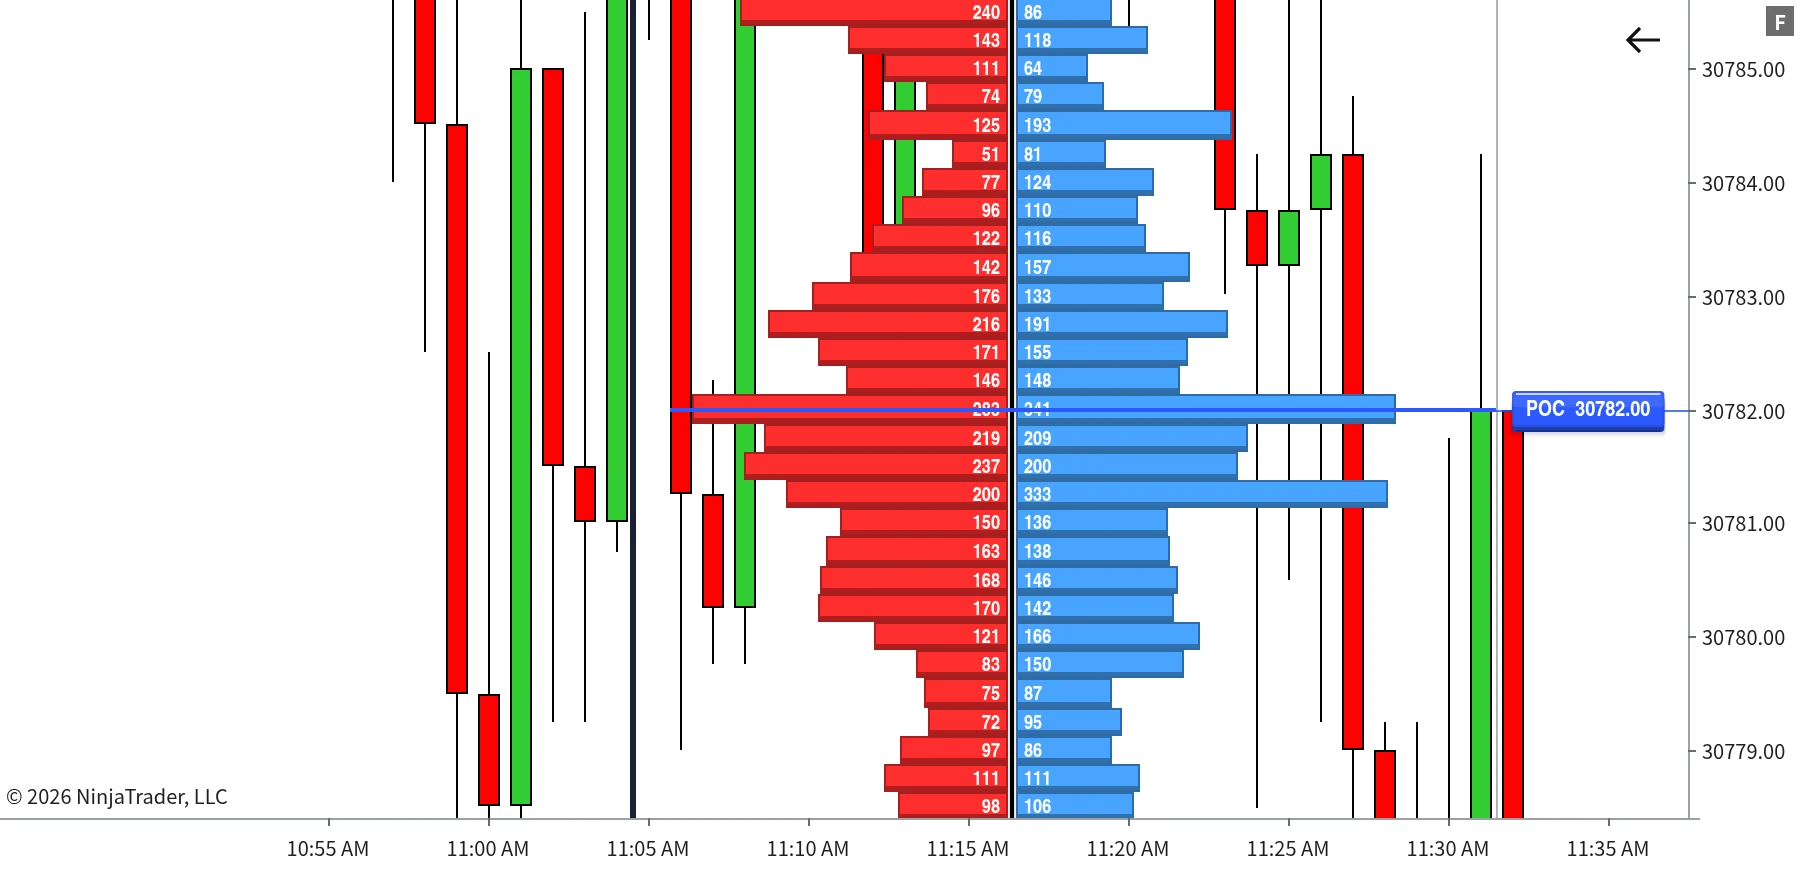
Profile+ showing bid and ask volume numbers at each individual price level
At its finest setting the profile shows one row per tick, with real bid and ask volume on each.
Classified on arrivalEvery trade print your feed delivers is judged the moment it lands, using the standard tick rule, and added to its exact price level immediately.
One row per tick, if you want itAt its finest setting the profile resolves to a single row per price tick, so nothing is grouped away before you see it.
Merge without losing accuracyTick Aggregation dials between raw granularity and a cleaner merged read across a wider zone. The underlying data never changes, only the display.
Built For

Who it's for

Traders who want a genuine volume profile and real order-flow detail in the same tool, over a range they choose themselves.

You want to choose the range yourselfA single opening drive or several weeks of history. Draw the window that matters instead of taking whatever a fixed session template hands you.
You want to know who traded, not just how muchEvery level carries real bid-side and ask-side volume, so acceptance and rejection have a side attached.
You work with Point of Control and Value AreaBoth are found automatically and updated live, with the Value Area percentage under your control.
You switch how you look at a rangeSix display modes from the same drawn zone, changed on the fly without redrawing anything.
You trade more than one productCalculations follow each instrument's own tick size, including fractional-tick interest rate products.
You're on NinjaTrader 8 with a live feedFull tick-by-tick bid/ask accuracy needs a feed providing CME Level 1 data with Tick Replay enabled.
Requirements

Requirements

Runs on NinjaTrader 8. Full tick-by-tick bid/ask accuracy requires a live data feed providing CME Level 1 data while the indicator is running and connected, with Tick Replay enabled on the chart's data series. Historical bars, those that printed before the indicator was attached and running, use an estimated split, since true historical bid/ask data isn't available from NinjaTrader's feed. If your feed or instrument doesn't provide CME Level 1 data, trades still process tick by tick using a midpoint-based classification in place of a true bid/ask comparison.

Video

Full Walkthrough Video

Every setting explained, plus real chart examples of TrackTicks Profile+ in use.

The Suite

The Full TrackTicks Suite

Profile+ is one part of the full order flow suite. All four indicators are included in a single subscription.

New to order flow terms like Delta, Point of Control, or Footprint charts? See the glossary →

Disclaimer

TrackTicks Profile+ is a charting and data-visualization tool. It does not generate buy or sell signals, does not predict future price movement, and is not a substitute for your own analysis, judgment, or risk management. Accuracy of the real-time bid/ask classification depends entirely on the completeness and timeliness of the data supplied by your NinjaTrader connection, data feed, and broker. Historical bars are shown using an estimated split rather than verified historical order-flow data.

Trading futures carries a substantial risk of loss and is not suitable for everyone. See the full site disclaimer for complete terms.


Works With
TrackTicks Support Usually replies within 24 hours
Have a question about setup, billing, or an indicator? Send us an email and we'll get back to you.
Email Us support@trackticksindicators.com